I have been working a little with PHP, for the first time for a while, and soon found it annoying not to have the convenience of instant application testing and line by line debugging. I have set up a PHP development environment before using XAMPP for Windows and Eclipse, but it was fiddly. I also prefer PHP on Linux, which is where my scripts will be running.
Since Windows 10 now has a Linux environment built-in, called Windows Subsystem for Linux (WSL), I decided to set this up to run Apache, PHP and MySQL and to try debugging my scripts there.
My PC is a recent installation and I had not yet installed WSL. To do so, you have to both download a Linux distribution from the Store (I chose Ubuntu), and enable WSL in Windows features. Then restart, launch Ubuntu, set a username and password, and you are up and running.
Note the Linux commands that follow should be run as root using sudo.
Before doing anything else, I got Ubuntu up to date:
apt-get update
apt-get upgrade
Then I installed the LAMP suite:
apt-get install lamp-server^
(the final ^ is intentional; see the guide here).
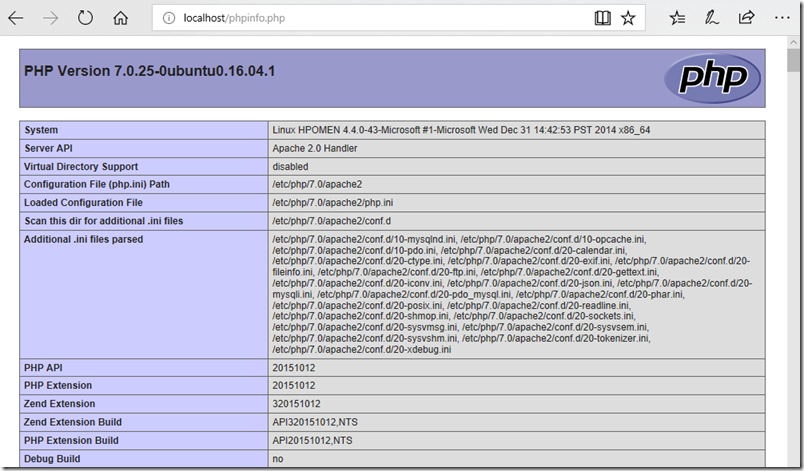
To check that everything is working, I created the file phpinfo.php in /var/www/html with the following contents:
<?php phpinfo(); ?>
and restarted Apache:
/etc/init.d/apache2 restart
Note: if you have IIS running in Windows, or another web server, Apache will not be able to listen on port 80. Change the port in /etc/apache2/ports.conf and in /etc/apache2/sites-enabled/000-default.conf
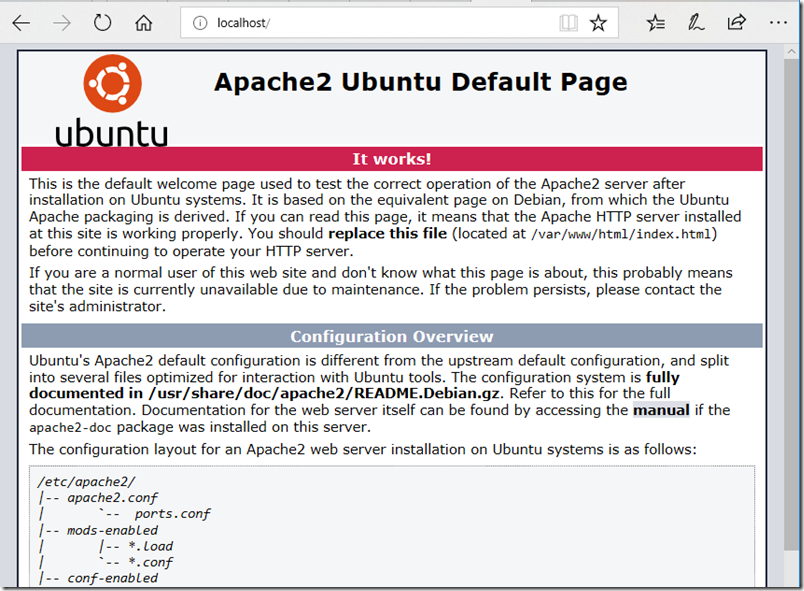
Then I opened a web browser on the Windows side and browsed to localhost:
and
We are up and running, but not debugging PHP yet. Remember the basic rules of WSL:
- you cannot change Linux files from Windows.
- you can access Windows files from Linux.
We want to edit PHP from Windows, so we’ll define a site that uses Windows files. Windows files are under /mnt/c (or whatever drive letter you are using).
So if you example you have your PHP website in a folder called c:\websites\mysite, you can have Apache serve files from that folder.
The quickest way to get up and running is to create a symbolic link in the Apache home directory, in my case /var/www/html. Change to that directory and type:
ln -s /mnt/c/websites/mysite mysite
Now you can view the site at http://localhost/mysite/
This worked first time for me, complete with PHP running. You could also set up multiple virtual hosts in Apache, and use the hosts file in Windows to map other host names to localhost.
Next, you probably want PHP to show error messages. To do this, replace the default php.ini with the development version (or tweak it according to your own preferences. At the time of writing, on Ubuntu, the default PHP version is 7.0 and php.ini-development is located in /usr/lib/php/7.0/php.ini-development. So I backed up the ini file at /etc/php/7.0/apache2, replaced it with the development version, and restarted Apache. My PHP form immediately showed me a non-fatal undefined index error, so it worked.
There is one small inconvenience. Apache in WSL will only run during the session. So before starting work, you have to open Ubuntu and type:
sudo apache2ctl start
Well, background task support is coming to WSL but I do not regard this as a big problem.
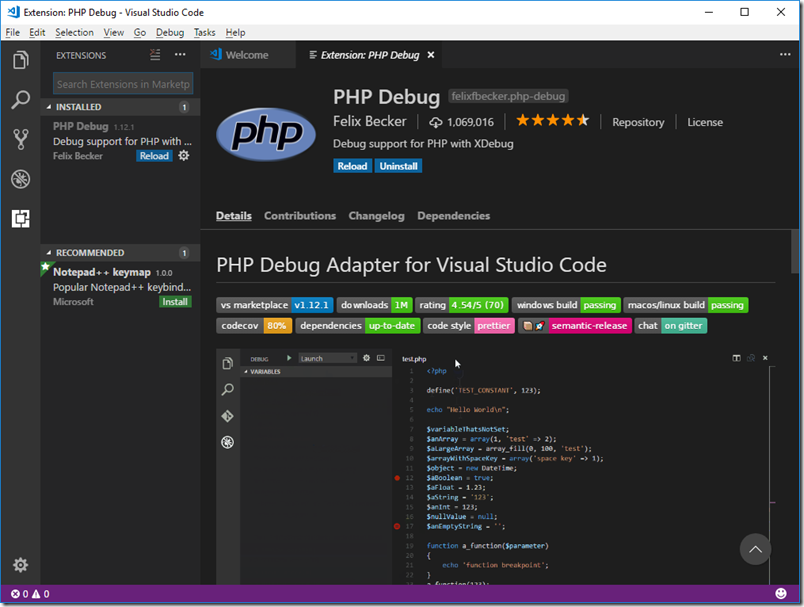
OK, this is cool, we can make changes in the PHP code in our favourite Windows editor, save, and view the results directly in the browser. But what about line-by-line debugging? For this, we are going to use Visual Studio Code with the PHP Debug extension:
Then on the Ubuntu side:
apt-get install php-xdebug
Restart Apache:
apache2ctl restart
Check that phpinfo.php now shows an Xdebug section. Then edit php.ini and add the following:
[XDebug]
xdebug.remote_enable = 1
xdebug.remote_autostart = 1
Restart Apache again and XDebug is ready to go.
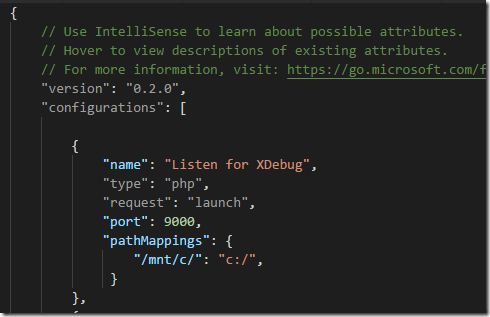
Over in Visual Studio code there is a little more work to do. The problem is that although everything is running on localhost, the location of the files looks different to Linux than to Windows. We can fix this with a pathMappings setting. In Visual Studio code, open the PHP file you want to debug. Click the Debug icon and then the little gearwheel near top left; this will open launch.json. By default there are a couple of settings for XDebug. These are OK for a default setup, but we need to add path mapping so that the debugger knows where to find the files. For example:
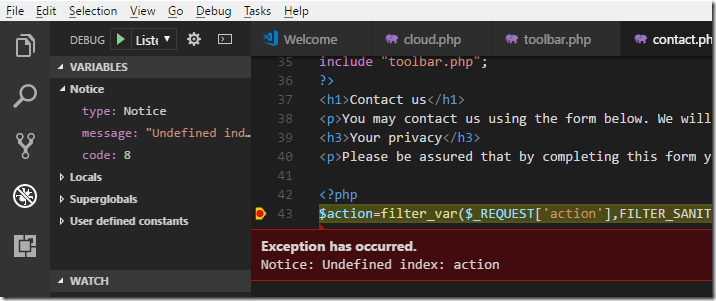
Now you can set a breakpoint, start debugging, and open the page in your browser:
More guidance on the PHP Debug extension by Felix Becker is here.
Final thoughts
This is cool; but is it better or worse than an old-style VM running Linux and PHP? The WSL solution is lightweight and convenient, but unlike a VM it is not isolated and you may hit issues that are unique to WSL, because not everything runs. I did happen to suffer crashes in Visual Studio and in Outlook while WSL was running; it may well be coincidence, but I cannot help wondering if WSL might be to blame.
Still, a great feature of WSL is that when you exit your session, it goes away, so it is not too intrusive. I plan to use it for PHP debugging and will see how it goes.
