Category Archives: business intelligence

What’s new in SQL Server 2012?

Microsoft’s SQL Server 2012 is released next month and available to download now (I am not sure what the distinction is). I have a high regard for Microsoft’s database server; it seems to me that the team mostly gets it right. The product has become somewhat diffuse though, especially as the Business Intelligence aspect has grown, and this may account for what to me is a rather unfocused launch for SQL Server 2012, even though its name suggests that it is the most significant release since SQL Server 2008.

The following slide summarises the new features, presumably with the type size suggesting the importance of each one.

image

But is the ODBC Driver for Linux really more important than the SQL Server Data Tools, for example? Not in my view; but that reflects how SQL Server represents different things to different people.

So what are the key new feature? Here’s my quick take.

Always On

A new feature called Availability Groups that is an improved version of database mirroring

Improved failover clustering which supports multi-site clustering across subnets – above to failover across datacentres.

ColumnStore Index

A new type of index for data warehouses. This is actually pretty simple: the name says it all. Here is Microsoft’s illustration:

image

and explanation:

A columnstore index stores each column in a separate set of disk pages, rather than storing multiple rows per page as data traditionally has been stored.

Why do this? Because it is more efficient when the query only requests a a few columns from the table. Microsoft claims performance improvements from 6X to 100X in cases where the the data can be cached in RAM, and thousand-fold improvements where the working set does not fit in RAM.

SQL Server Data Tools

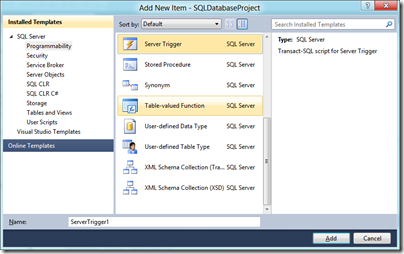
This is my favourite feature, probably because it is developer-focused. These are the tools that were code-named “Juneau” and which install into Visual Studio 2010. There are some visual tools, but this is essentially a code-centric approach to database design, where you design your database with all its tables, queries, triggers, stored procedures and so on. You can then build it and test it against a private “localdb” instance of SQL Server. What I like is that the database project includes the entire design of your database in a form that can be checked into source control and compared against other schema versions. Here is the Add New Item dialog for a database project:

image

Data Quality Services

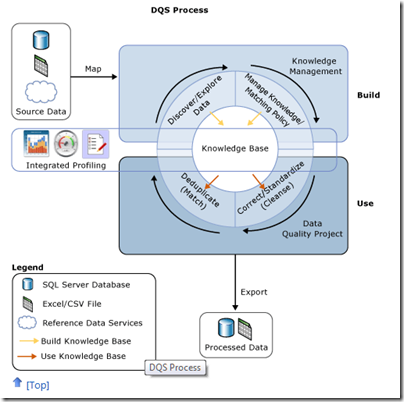
Data Quality Services (DQS) lets you check your data against a Data Quality Knowledge Base (DQKB), the contents of which are specific to the type of data in the database and may be created and maintained by your business or obtained from a third-party. If your data includes addresses, for example, the DQKB might have all valid city names to prevent errors. Features of DQS include data cleansing, de-duplication through data matching, profiling a database for quality, and monitoring data quality.

image

Illustration and more details are here.

Updated SQL Server Management Studio

SQL Server Management Studio now runs in the Visual Studio 2010 shell.

LocalDB

LocalDB is a local instance of SQL Server aimed at developers and for use as an embedded database in single-user applications. It is a variant of SQL Server Express, but different in that it does not run as a service. Rather, the LocalDB process is started on demand by the SQL native client and closed down when there are no more connections. You can attach database files at runtime by using AttachDBFileName in the connection string. LocalDB is intended to replace user instances which are now deprecated.

FileTables

This is the most intriguing feature in SQL Server 2012. It is described here:

The FileTable feature brings support for the Windows file namespace and compatibility with Windows applications to the file data stored in SQL Server … In other words, you can store files and documents in special tables in SQL Server called FileTables, but access them from Windows applications as if they were stored in the file system, without making any changes to your client applications.

and the purpose:

Enterprises can move this data from file servers into FileTables to take advantage of integrated administration and services provided by SQL Server. At the same time, they can maintain Windows application compatibility for their existing Windows applications that see this data as files in the file system.

Integration of the file system and the database is not a new idea, and Microsoft has tried variants before, such as the “M” drive that was once part of Exchange, the aborted WinFS feature planned for Windows Longhorn (Vista), and SharePoint, which can store documents in SQL Server while presenting them as Windows file shares through WebDAV.

That said, FileTables in SQL Server 2012 are not an attempt to reinvent the file system, but presented more as a way of supporting legacy applications while managing data in SQL Server. It is an interesting feature though, and it would not surprise me if users find some unexpected ways to exploit it.

Power View

Codenamed “Project Crescent”, this is a web-based reporting client for businesses that have embraced Microsoft’s platform, because it has several key dependencies:

  • SharePoint Server Enterprise Edition
  • SQL Server Reporting Services
  • Silverlight on the client

In fact, Power View is described as:

a feature of SQL Server 2012 Reporting Services Add-in for Microsoft SharePoint Server 2010 Enterprise Edition

Power View reports that I have seen do look good, and have an Office ribbon style designer for designing customising the report. That said, I would guess that Microsoft now wishes it had used HTML 5 rather than Silverlight for this – there are those Apple iPad and Windows 8 Metro users to think of, after all.

Microsoft emphasises that Power View is not a replacement for Report Designer or Report Builder, but an ad-hoc reporting tool.

Closing thoughts

There is more in SQL Server 2012, as a glance back at the initial slide will tell you, but the above is a starting point if you are wondering what it is all about. It is also worth noting that Microsoft still gives away SQL Server Express which supports up to 10GB per database and includes many of same features as the paid-for versions; it is the same product at heart.

Someone who finds that SQL Server Express actually meets all their needs asked me why Microsoft gives it away. My guess is that this is a consequence of all the other free database engines available such as MySQL, PostgreSQL, interesting  newer NoSQL options like mongoDB, and of course equivalent free versions of Oracle and IBM DB2. A proportion of customers who start with SQL Server Express will grow into the paid-for editions.

This does make SQL Server Express an excellent choice for smaller scale applications and small businesses, particularly since it integrates smoothly into Microsoft’s developer stack. Having said which, I am becoming something of an Entity Framework sceptic, but that is a story for another day – and fortunately you do not have to use EF if you do not want to.

Wolfram announces Computable Document Format for interactive docs

Wolfram has announced the Computable Document Format (CDF), a document format that enables live computation to be embedded within it. “It’s a new way to communicate the world’s quantitative ideas much more richly than we have in the past, and in doing that a new kind of active document,” says  Conrad Wolfram, Strategic Director of Wolfram Research. That said, the technology here is not really new. There is a close relationship between CDF and Mathematica, Wollfram’s tool for creating mathematical calculations and simulations. The authoring tool for CDF is Mathematica:

image 

The announcement then is really about a new player for Mathematica content and applications, to broaden their usage. The CDF player is free, though there are some limitations. If you charge for your document, or want to display it without the player chrome, then a paid licence is needed. A CDF document can also be compiled into a standalone executable, blurring the distinction between document and application.

The CDF player is available for Mac, Windows and Linux. There is also a browser plug-in for embedding CDF documents into web pages.

It is easy to find use cases for CDF. It is for documents where there is value in performing calculations or interacting with data within the page. An example is pension planning:

image

We have all seen those documents with a series of projections based on different assumptions about retirement age, contributions, investment growth and so on. This works better as an interactive chart where you can enter whatever values you like.

Other examples are statistical analysis and business intelligence, textbooks and course books where students can interact with equations and simulations, business proposals where you want to show how financial projections change based on different assumptions, or even general news reports where instead of a static chart you might want to show interactive graphics that let readers drill down into the data that interests them, or see real-time results.

Along with the computation engine, CDF supports a decent range of traditional content formatting features including cascading stylesheets.

Wolfram is correct in assuming that this kind of interactive document is important, and something we will increasingly take for granted in the era of the Web, eBooks and tablets. But can it succeed in establishing its own new document format when we already have HTML, Adobe PDF and Flash, Microsoft Excel and PowerPoint, and other formats which are also capable of embedded interactive content?

That is a key question. Wolfram offers a table which claims to show the benefits of CDF versus competitors such as HTML and PDF, but it is as skewed as these tables usually are. Wolfram says a PDF document cannot be compiled as a standalone executable, for example, but a PDF in an Adobe AIR application comes close. It is also worth noting that you can embed Flash in PDF, which would be an obvious route to something like the pension planning document mentioned above.

Nevertheless, CDF does have advantages. In particular, it has Mathematica, and whereas authoring a Flash applet requires programming and design skills, Mathematica is more approachable presuming you have the necessary mathematical, scientific or financial skills; and if you do not, you should not be authoring the document. Mathematica will construct a user interface automatically. It also has a huge range of built-in algorithms, functions and charts. Wolfram claims that authoring a CDF should be within reach of anyone who can work with an Excel macro.

The challenge Wolfram faces is how to make CDF usable across a broad range of devices and clients. Having to install a player or plug-in is a considerable deterrent. PDF or better still HTML5 has broader reach and works on Google Android and Apple iOS as well as on desktop PCs.

I tried the CDF plugin and player on Windows 7 and encountered several issues. The plug-in does not play nicely with Internet Explorer’s Protected mode and I saw this dialog frequently:

image

I also had some issues with the player. I could not get an example document on Gulf Oil Spill Estimation to work:

image

The player is currently for Windows, Mac and Linux – what about Apple iOS? Wolfram says it is working on this, with a two-pronged approach. One idea is presumably based on some sort of app, I’d guess either a player if Apple allows it, or some way to compile a CDF into an app. The other idea is to render the interactive parts server-side, so you could use them in a web page without a plug-in. This second idea could also remove the need for a plug-in on the desktop. You will get a performance hit because of all those trips back and forth to the server, but this could be mitigated by high performance computing on the server that will perform calculations more quickly than your client.

I can see CDF being popular within its niche, but whether it can transition into being a mass-market format I am not sure. Established plug-ins and runtimes such as Adobe Flash, Microsoft Silverlight, and Java on the client are all under pressure, particularly as Apple’s iOS spreads its reach; it is not a good moment to launch a new format that has a plug-in or runtime dependency. I wonder if Wolfram is exploring the possibility of compilation to HTML5 and JavaScript?

Despite these reservations, the broader vision behind CDF seems to me spot-on. There are many cases where we currently see static charts, that would be better served by an embedded computation engine.

PivotViewer comes to SilverLight – data as visual collections

Microsoft has released a PivotViewer control for Silverlight. Data visualisation is a key business reason to use Silverlight or Flash rather than HTML and JavaScript for an application, so it is a significant release. But what does it do?

PivotViewer is the latest tool to come out of the Microsoft Live Labs Pivot project. Pivot is based on collections, which are sets of data where each item has an associated image. A pivot item has attributes, similar to properties, called facets; and facets have facet categories. Facet categories are used to filter and sort the data.

More complex Pivot data sets have several linked collections, or dynamic collections which are generated at runtime as a query result. This is necessary if the size of the data set is very large or even unbounded. You could create a web search, for example, that returned a pivot collection.

Once you have created and hosted your Pivot collections, most of the work of displaying them is done by the Pivot client. There is a desktop Pivot client, which is Windows-only; but the Silverlight PivotViewer is more useful since it allows a Pivot collection to be viewed in a web page. The client (or control) does most of the work of displaying, filtering and sorting your data, including a user-friendly filter panel.

PivotViewer also makes use of Deep Zoom, also known as Seadragon, which lets you view vast images over the internet while downloading only what is needed for the small section or thumbnail preview you are viewing.

The result is that a developer like Azure Technical Strategist Steve Marx was able to create a PivotViewer for Netflix with only about around 500 lines of code. This kind of product selection is a natural fit for Pivot.

I was quickly able to find the highest-rated music movies in the Netflix Instant Watch collection.

image

Starting with the full set, I checked Music and Musicals and then set Rating to 4 or over.


image

It seems to me that the strength of Pivot is not so much that it offers previously unavailable ways to visualise data, but more that it transforms a complex programming task into something that any developer can accomplish. Microsoft at its best; though of course it will only work on platforms where Silverlight runs.